Tide Predictions...
1 - Information from the chart
Most often the chart presents succinct
tide tables for certain positions.
 These positions are marked with the 'square'. The table
below shows us an example for two different positions.
The first refers to Cowes (UK), the second to a position
south of Cowes.
These positions are marked with the 'square'. The table
below shows us an example for two different positions.
The first refers to Cowes (UK), the second to a position
south of Cowes.
|
Position |
Heights above LAT |
|
Mean HW |
Mean LW |
|
Spring |
Neap |
Spring |
Neap |
|
Cowes |
1.7
m |
1.5
m |
0.2
m |
0.4
m |
|
|
5.2
m |
4.3
m |
0.4
m |
1.2
m |
This data
only provides us with average high and low waters
heights. Moreover, it is merely valid at spring or neap
tides. To use it we need to first find out how many
hours we are from high water. Secondly, we need to know
if it is spring or neap or sometime in between at that
particular moment. We shall use this table to solve two
types of problems. Finding height of tide at a
particular location at a particular time:
|
 |
To
get over a shoal. |
|
|
To
pass under a bridge. |
Almanacs
and many other nautical publications contain predictions
of the times of high and low tides at many major
standard ports .
Also listed are differences in times of tides from these
ports for additional secondary ports.
To work with this succinct data we need two extra tools: .
Also listed are differences in times of tides from these
ports for additional secondary ports.
To work with this succinct data we need two extra tools:
|
|
 To
interpolate between high and low water heights
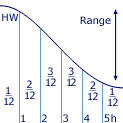
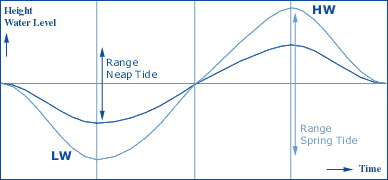
we use the Rule of
Twelve. We assume the tidal curve to be a
perfect sinusoid with a period of 12 hours. The
height changes over the full range in the six
hours between HW and LW. To
interpolate between high and low water heights
we use the Rule of
Twelve. We assume the tidal curve to be a
perfect sinusoid with a period of 12 hours. The
height changes over the full range in the six
hours between HW and LW.
|
 |
During first hour after HW the water
drops 1/12th
of the full range. |
|
|
During the second hour an additional
2/12th. |
|
|
During the third hour an additional
3/12th. |
|
|
During the fourth hour an additional
3/12th. |
|
|
During the fifth hour an additional
2/12th. |
|
|
During the sixth hour an additional
1/12th. |
Hence, two hours after the HW the water has
fallen 3/12 of the full range. |
|
|
To
interpolate between spring and neap tides we use
the Rule of Seven.
Since the change from spring range to neap range
can be assumed linear (instead of sinusoid),
each day the range changes with 1/7th of
difference between the spring and neap ranges.
Hence, the daily change in range is (spring
range - neap range)/7. |
Shoal problem:
Our shoal near Cowes has a charted depth of 1 meter and
we would like to cross it at about 15:00 hours with our
yacht (draft 1,5 m).
From any nautical almanac we find that
HW occurs at 03:18 15:53 and LW occurs at
09:45 22:03at a standard port nearby. We also find
that at our location HW occurs one hour later and that
spring tide is due in two days. Hence, we have a HW
around 17:00.
|
|
Via
the rule of seven we find out that today the
range is:
spring range - 2 x ( (spring range - neap
range)/7 )
<=> 4,8 - 2 x ( ( 4,8 - 3,1)/7 ) <=> 4,8 - 2 x
0,25 = 4,3 m.
|
|
|
We
also need today's HW height:
which is Spring HW - 2
days x ( (5,2 -4,3)/7 ) = 5,0
m.
|
|
|
Via
the rule of twelve we find out that at two hours
before high water the height is:
5,0 - 3/12 x 4,3 = height at 15:00 hours =
3,9 m.
|
So, after three interpolations we derive
the water height at 1500 hours. Considering the charted
depth leads to an observed depth of 4,9 meters, enough
for our draft of 1,5 meters.
Bridge problem:
An overhanging rock, power lines or bridges have their
clearances charted with respect to another chart datum
than LAT. Normally, 'high water' or 'MHW spring' are
used as reference planes.
An example:
Above our shoal hangs the 'Cowes bridge'. At 15:00 hours
we would like to pass this bridge, which has a charted
height of 20 meters to HW. Our mast is 23 meters high.
In the example above we found that the water height was
1,1 meters below HW level at that time. Obviously, we
will have to wait!
So, at what time will we be able to pass under this
bridge?
The water height must be 3 meters lower than HW level
(5,0 m). That is almost 9/12 of the range (4,3 m)
indicating four hours after HW.
Conclusion, we will have to wait at least six hours in
total.
2 - Information from tide tables
Instead of mere averages, a tide table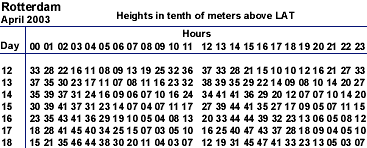 provides us each day with the times of high and low
water for a particular place. Basically, it is same
table like the one we found in the chart, but is
extended for every day in a year. By using this method
we get more accurate water heights since it involves
less interpolation. The example shows us a part of a
very detailed tide table, which even includes heights
for every hour.
provides us each day with the times of high and low
water for a particular place. Basically, it is same
table like the one we found in the chart, but is
extended for every day in a year. By using this method
we get more accurate water heights since it involves
less interpolation. The example shows us a part of a
very detailed tide table, which even includes heights
for every hour.
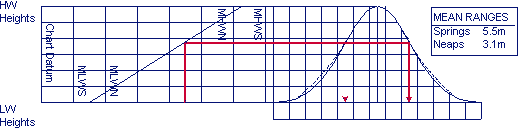
3 - Information from tidal curves
In most tables the tides can also be
characterized by a tidal curve. This method substitutes
the rule of twelve providing more accurate heights. The
left side contains the water height information with the
lowest heights to the left where also the chart datum is
indicated. The low water height will be marked at the
bottom and the high water height will be marked at the
top.
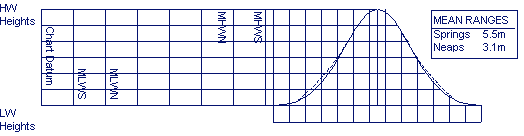
The area under the curve will be marked with the time
information.
To find the water height at a specific time we need to
know first how many hours before or after the HW this
is. Then
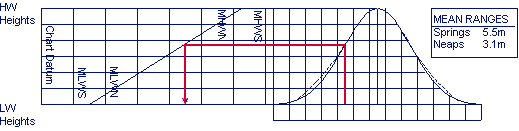
Often this is done when the curve is not sinusoid and
the rule of twelve is rendered useless.
|
![]()
|

 Featuring
two highs and two lows each day, with
minimal variation in the height of
successive high or low waters. This type is
more likely to occur when the moon is over
the equator.
Featuring
two highs and two lows each day, with
minimal variation in the height of
successive high or low waters. This type is
more likely to occur when the moon is over
the equator. Only
a single high and a single low during each
tidal day; successive high and low waters do
not vary by a great deal. This tends to
occur in certain areas when the moon is at
its furthest from the equator.
Only
a single high and a single low during each
tidal day; successive high and low waters do
not vary by a great deal. This tends to
occur in certain areas when the moon is at
its furthest from the equator.