Click chart to see the whole world!
Currents reflect the horizontal movement of water whereas tides reflect vertical movements. These currents influence the ship's position and are therefore important to understand. The horizontal movement is primarily caused by the gravitational pull of celestial bodies. But also other factors are in play:
differences in water temperatures caused by heating and cooling due to the earth's atmosphere;
differences in salinity caused by rain, evaporation and estuaries;
wind induced friction
the Coriolis force which is a consequence of the earth's rotation.
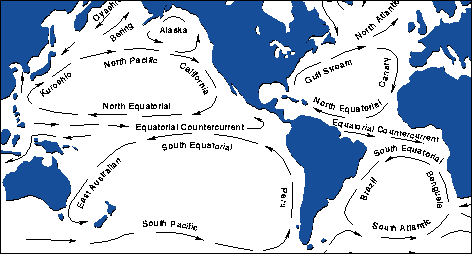
Prominent features in the map of the major oceanic surface currents include the subtropical gyres centered on 30 degrees latitude in each of the major ocean basins. The earth's rotation (origin of the Coriolis force) and the change in wind direction with latitude (from the east in the tropics and from the west at mid-latitudes) cause the circulation of the gyres to be clockwise in the Northern Hemisphere and counterclockwise in the Southern Hemisphere. The well-known Gulf Stream in the Atlantic and its counterpart in the Pacific, the Kuroshio Current, are strong currents that carry heat northward from the tropics. The deep oceanic currents (not shown) are caused primarily by water density differences and in general return the (now colder) water back towards the tropics.
Click chart to see the whole world!
To predict the behavior of major ocean currents several references are available. The Sailing Directions Planning Guides contain some information on normal locations and strengths of ocean currents. Nevertheless, the Pilot Charts are by far the best reference for predicting the direction and speed of these currents. On these charts, arrows indicate the direction of the prevailing current; a number printed above the arrow indicates the average speed. Since this information is based upon historical averages, it won't predict the actual ocean current encountered with 100% accuracy.
Ocean surface currents need not be considered in coastal areas. Usually, when close to the continental shelf, the horizontal movement of water is defined by two terms:
tidal stream or tidal current: gravitational
current: grafitational, rivers, wind
In order to predict tidal stream one needs to use tide tables in conjunction
with a tidal atlas, or a
chart diamond.
Tidal streams are described by drift/rate
and set, in which drift/rate is the speed and set is
the direction of the current.
Tidal stream atlases show the tidal currents for each hour of the tidal cycle.
They comprise a total of 13 tidal charts ranging from 6 hr before HW till 6 hr
after HW. So, these charts are relative to the time of HW and to use them we
must know the absolute time of HW.
Though several layouts can be used, usually the direction of the tidal stream is
shown by arrows, which are heavier where the tidal streams are stronger. Figures
against the arrows give the mean neap and spring drift or
rate in tenths of knots.
For example, ![]() indicates a mean neap drift of 2.1 knots and a mean spring drift of 4.6 knots.
indicates a mean neap drift of 2.1 knots and a mean spring drift of 4.6 knots.
rotterdam
![]()
Working on it, nearly finished :-)